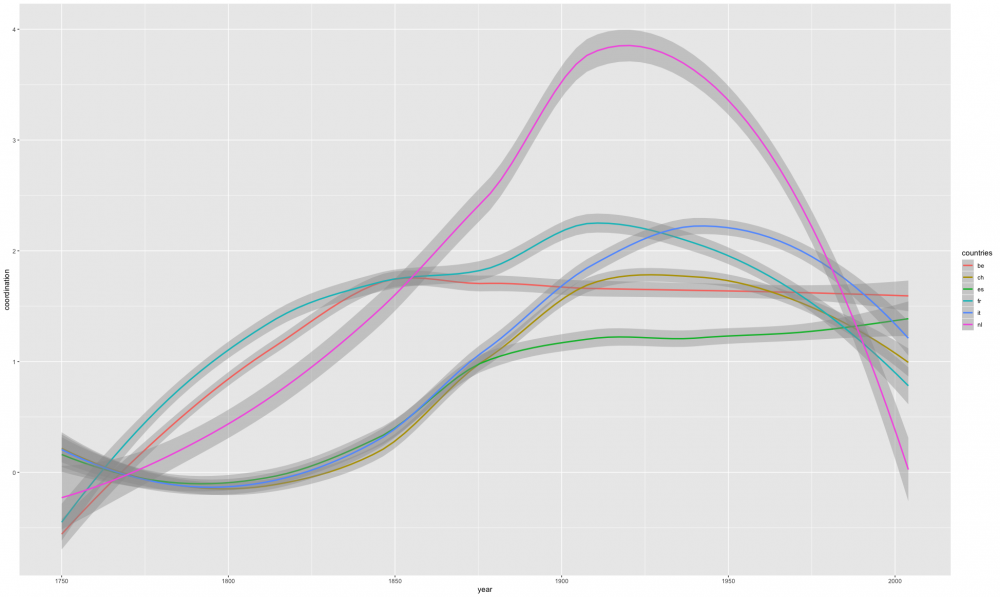
Schéma présentant l’apport de chaque nouvelle règle à la capacité d’ensemble de coordination de la gouvernance dans le temps; c’est-à-dire l’ “amélioration” de la gouvernance apportée par chaque nouvelle règle. Les différentes phases sont visibles avec une amélioration de plus en plus forte jusqu’à un point de retournement, où l’amélioration devient ensuite de plus en plus faible. Un exemple de lecture pour le cas suisse (courbe marron): A partir de 1850, chaque nouvelle règle améliore de plus en plus la capacité de coordination. Cette capacité stagne à son point culminant durant la première partie du XXe siècle, pour ensuite s’étioler peu à peu. Ainsi, en 2006, la capacité d’amélioration de la coordination de chaque nouvelle règle retrouve un niveau de l’ordre de celui atteint durant la seconde moitié du XIXeme siècle.
--------
A diagram showing the contribution of each new rule to the overall capacity for governance coordination over time; i.e. the "improvement" of governance provided by each new rule. The different phases are visible with an increasingly strong improvement until a turning point, where the improvement then becomes weaker. An example of a reading for the Swiss case (brown curve): From 1850 onwards, each new rule increasingly improves the ability to coordinate. This capacity stagnated at its peak during the first part of the 20th century, only to decline gradually. Thus, in 2006, the capacity to improve the coordination of each new rule returned to a level on the order of that reached in the second half of the 19th century.


